Data visualization/데이터시각화(R)
데이터시각화(R)_Shiny
뉴욕킴
2023. 10. 3. 18:03
Shiny란?
- R에서 웹 프로그래밍을 가능하게 해주는 패키지
- 최신 웹 브라우저를 이용하여 인터렉티브한 데이터 정리와 질의를 쉽게 할 수 있는 기능을 제공
- 다양한 위젯이 있어 사용자 인터페이스와 인터렉티브 기능을 쉽고 빠르게 구현할 수 있게 함
install.packages("shiny")library(shiny)- 샘플 불러오기
runExample("01_hello")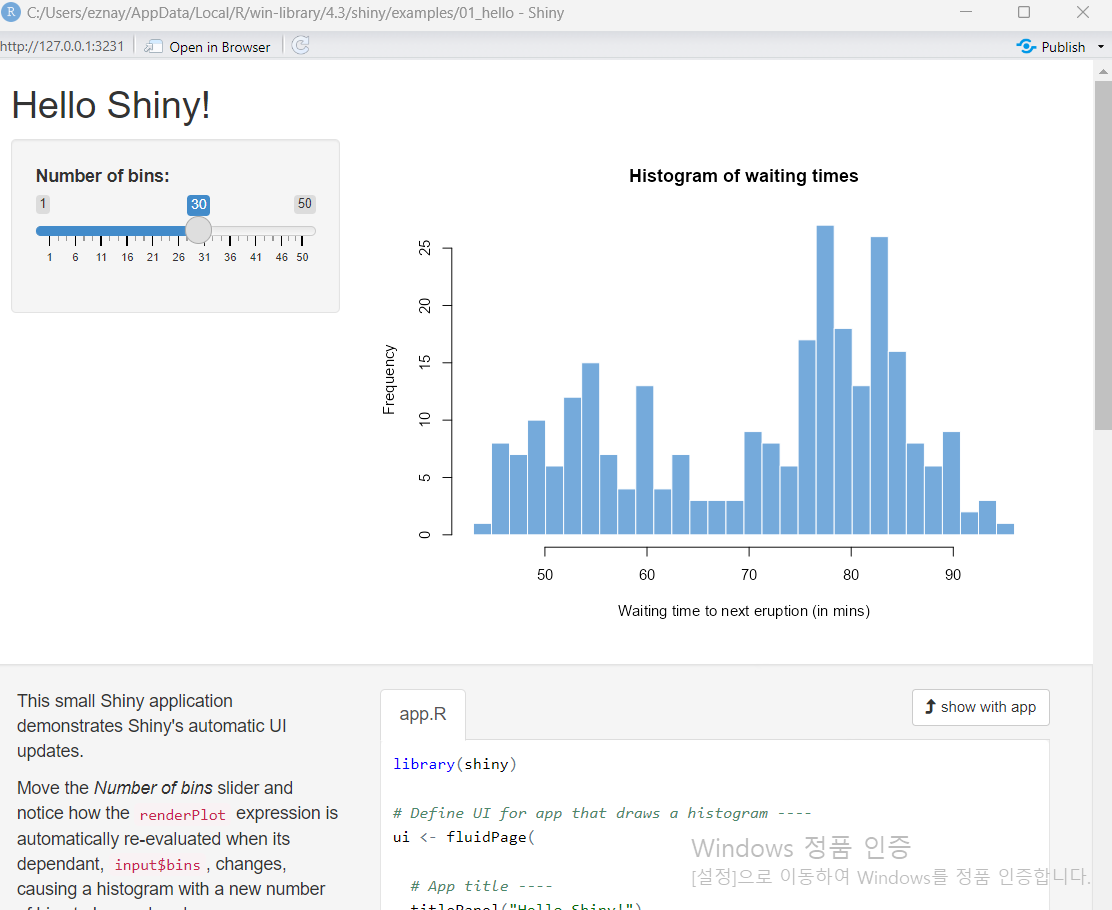
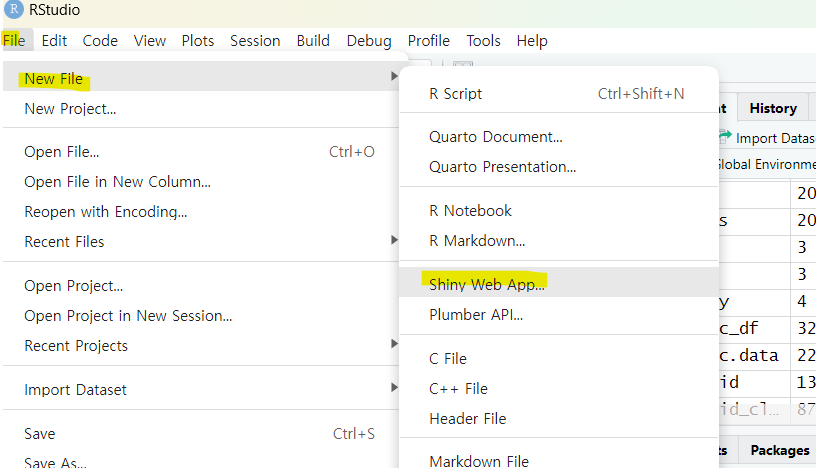
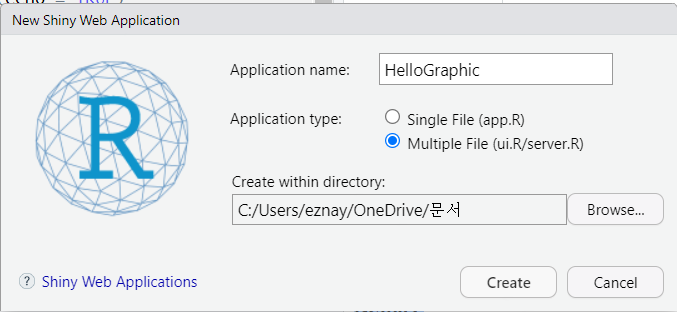
- Shiny Web App
# Define UI for application that draws a histogram
fluidPage(

    # Application title
    titlePanel("Old Faithful Geyser Data"),

    # Sidebar with a slider input for number of bins
    sidebarLayout(
        sidebarPanel(
            sliderInput("bins",
                        "Number of bins:",
                        min = 1,
                        max = 50,
                        value = 30)
        ),

        # Show a plot of the generated distribution
        mainPanel(
            plotOutput("distPlot")
        )
    )
)- fluidPage는 bower의 크기에 따라 자동조절이 가능한 webpage로 만들기 위한 함수
- sidebar panel과 main panel을 구성
- sidebar는 왼쪽에, main panel은 오른쪽에 나타남
- sidebar를 오른쪽으로 바꾸기 위해서는 position="right" 옵션을 이용
library(shiny)
shinyServer(function(input, output) {
output$distPlot <- renderPlot({
x <- faithful[, 2] # Old Faithful Geyser data
bins <- seq(min(x), max(x), length.out = input$bins + 1)
hist(x, breaks = bins, col = 'darkgray', border = 'white')
})
})- 명령어로 실행 HTML tag 기능을 이용한 UI 구성
shinyUI(fluidPage(
titlePanel("HTML tag examples"),
sidebarLayout(
sidebarPanel("SideBar"),
mainPanel("Main Panel",
h1("First level title"),
h3("First level title"),
h5("First level title"),
strong("Bold title"),
em("Italic title"))
)
))
shinyServer(function(input, output) {
})
shinyUI(fluidPage(
titlePanel("Basic widgets"),
fluidRow(
column(3,
h3("Buttons"),
actionButton("action", label = "Action"),
br(),
br(),
submitButton("Submit")),
column(3,
h3("Single checkbox"),
checkboxInput("checkbox", label = "Choice A", value = TRUE)),
column(3,
checkboxGroupInput("checkGroup",
label = h3("Checkbox group"),
choices = list("Choice 1" = 1,
"Choice 2" = 2, "Choice 3" = 3),
selected = 1)),
column(3,
dateInput("date",
label = h3("Date input"),
value = "2014-01-01"))fluidRow(
column(3,
dateRangeInput("dates", label = h3("Date range"))),
column(3,
fileInput("file", label = h3("File input"))),
column(3,
h3("Help text"),
helpText("Note: help text isn't a true widget,",
"but it provides an easy way to add text to",
"accompany other widgets.")),
column(3,
numericInput("num",
label = h3("Numeric input"),
value = 1))
),fluidRow(
column(3,
radioButtons("radio", label = h3("Radio buttons"),
choices = list("Choice 1" = 1, "Choice 2" = 2,
"Choice 3" = 3),selected = 1)),
column(3,
selectInput("select", label = h3("Select box"),
choices = list("Choice 1" = 1, "Choice 2" = 2,
"Choice 3" = 3), selected = 1)),
column(3,
sliderInput("slider1", label = h3("Sliders"),
min = 0, max = 100, value = 50),
sliderInput("slider2", "",
min = 0, max = 100, value = c(25, 75))),
column(3,
textInput("text", label = h3("Text input"),
value = "Enter text..."))
)
))CensusVis
library(shiny)
shinyUI(fluidPage(
titlePanel("censusVis"),
sidebarLayout(
sidebarPanel(
helpText("Create demographic maps with
information from the 2010 US Census."),
selectInput("var",
label = "Choose a variable to display",
choices = c("Percent White", "Percent Black",
"Percent Hispanic", "Percent Asian"),
selected = "Percent White"),
sliderInput("range",
label = "Range of interest:",
min = 0, max = 100, value = c(0, 100))
),
mainPanel(plotOutput("map"),
textOutput("text1"))

source("helpers.R")
library(maps)
library(mapproj)
counties <-readRDS("./data/counties.rds")
shinyServer(
function(input, output) {
output$map <- renderPlot({
data <- switch(input$var,
"Percent White" = counties$white,
"Percent Black" = counties$black,
"Percent Hispanic" = counties$hispanic,
"Percent Asian" = counties$asian)
color <- switch(input$var,
"Percent White" = "darkgreen",
"Percent Black" = "black",
"Percent Hispanic" = "darkorange",
"Percent Asian" = "darkviolet")

legend <- switch(input$var,
"Percent White" = "% White",
"Percent Black" = "% Black",
"Percent Hispanic" = "% Hispanic",
"Percent Asian" = "% Asian")
percent_map(var = data,
color = color,
legend.title = legend,
max = input$range[2],
min = input$range[1])
})
})
- 참고자료
https://shiny.rstudio.com/gallery/widget-gallery.html
Shiny - Widget Gallery
Shiny is a package that makes it easy to create interactive web apps using R and Python.
shiny.posit.co